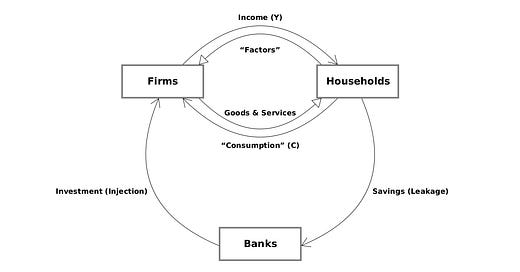
We’ve seen how the traditional 3-sector circular flow model is so flawed that it’s worse than useless: it’s actually misleading (e.g. treating household savings as a donation from households to banks).
Let’s add the banking sector to the One Lesson’s 2-sector model to get something that works far better.
As a reminder, here’s the model without a banking sector:
In the 2-sector model, we assumed there’s a fixed amount of money which was introduced before the flow was started. For the 3-sector model, we’ll assume there isn’t any money to start with, but that it’s introduced when firms borrow from the banking sector.
For now, we’ll assume banks only lend to firms, and that they don’t charge interest. We can consider lending to households and charging interest another time.
The One Lesson’s 3-sector model
In the series on money and banking, we saw that bank lending involves the borrower and lender each creating a new debt owed to the other. (The lender’s debt is more widely accepted than the borrower’s, and is generally accepted as money). Also, repaying the debt involves borrower and lender each writing off the debt owed to them by the other.
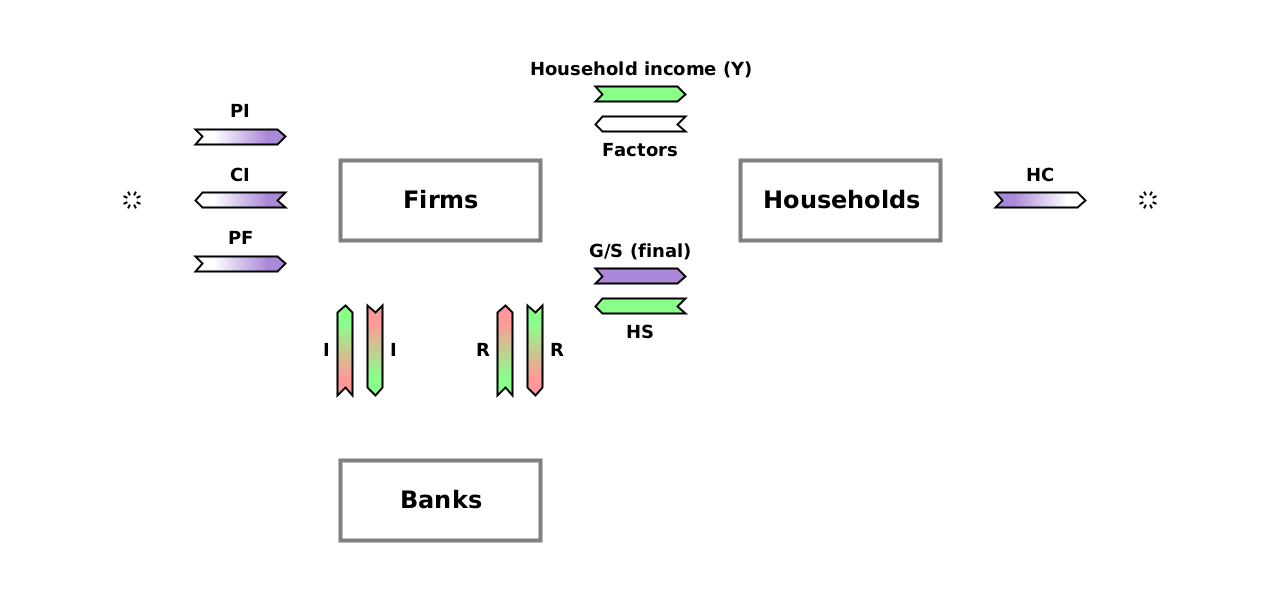
So here is the One Lesson version of the 3-sector model:
Remember that this represents all of the actions over a period of time (generally a year). So for example, Y is the total of all payments from firms to households (wages, dividends) in that period.
Most of the diagram is exactly the same as before. The only addition is the banks, and the arrows between them and the firms.
On the left we have borrowing: banks create an amount of new money, I1, for firms, in exchange for the firms promising to pay banks the same amount, I, later.
On the right we have repayment: the firms give up some of their bank balance, R, in exchange for the banks agreeing that the firms’ outstanding debt to the banks is reduced by the same amount, R.
You may be wondering: Where’s the arrow from households to banks for household saving? There isn’t one! Firms pay households by transferring some of the (bank-created) money in their accounts to households’ accounts. And when households spend on goods and services, they just transfer some of the money in their accounts back to the firms’ accounts (e.g. by using a debit card). Households save money simply by transferring back less than they received. That is, they accumulate assets in the form of balances in their bank accounts (representing debts owed to them by the banks).
One advantage of this model over the traditional one is that it shows that money is constantly being created and destroyed. There isn’t a fixed amount of money which is gradually removed from circulation as households save. (It seems to me that that assumption is behind the belief in the so-called “paradox of thrift” — that household saving causes economic downturns. I’m convinced it’s simply wrong).
The whole as the sum of the parts
It’s very useful to imagine the sequence of actions which would occur for just a single loan:
New money is created (“injected” into the circular flow between firms and households) when a firm borrows2.
The money is transferred to households in exchange for factors, helping the firm to produce goods and services.
Later, the money is gradually transferred from households back to firms when the households buy goods and services. (This could be in later time periods — possibly much later). It’s unlikely that all of the money which went to households will come straight back to the original firm. Households may buy goods and services from other firms3.
The money can continue to flow around the circuit from firms to households (in exchange for factors) and back (in exchange for goods and services) any number of times4.
Eventually, the firm which borrowed from a bank obtains enough money to repay the loan, and does so. This causes the money to be destroyed (a “leakage” from the circular flow), and the sequence is complete: the amount of money is back where it started. It has served its purpose by facilitating economic activity over its lifetime — perhaps a huge amount of it.
That was a sequence for just a single loan. The reality of the whole economy will look more complicated for a couple of reasons:
If a firm has earned back enough money to repay a previous loan, but now wants to spend on new production, it probably won’t bother repaying the previous loan and taking out a new loan, but just “roll it over”. Even though there aren’t as many transactions between banks and firms this way, the outcome is identical.
There are vast numbers of these sequences, which overlap in time. Some firms will be investing in new production while others are paying off previous loans. Some sequences may last just a few weeks, while others take many years.
But to understand what is happening, we only need to understand a single sequence, and realise that the whole economy consists of these many sequences layered on top of each other. The total amount of money in circulation at any point in time is just the amount which was borrowed in the past (in sequences which have started) minus the amount that has been repaid (in sequences which are now complete).
Thinking in terms of these sequences, rather than some sort of imaginary equilibrium, helps to make sense of the whole economy.
Summary
The One Lesson’s 3-sector circular flow model shows a much more accurate (and intuitive) picture of the economy than the traditional one. Money is lent to firms, flows around the circuit between firms and households a number of times, and is then repaid. Many of these sequences are taking place concurrently, but we can easily understand the complex result because it is just the “superposition” of the individual sequences5 which have started and aren’t yet complete.
‘I’ is the letter usually used for this, standing for “investment”.
In exchange for the firms promising to repay the banks later.
How did these firms sell goods and services if they didn’t spend on factors to produce them? Good question! There are many possibilities. For example, shareholders could work for no pay to produce some goods and services for the firm to sell. The firm’s income from this can then be used to pay for factors to produce more goods and services to sell.
Or it can flow between firms in exchange for intermediate goods and services. This isn’t shown on the diagram because the transfers are internal to the firms sector.
I.e. it’s just the sum of all of the individual circular flow sequences.


Looking forward to (5), when you introduce interest. That could be "interesting".