John Maynard Keynes, a 20th century British economist, has had a profound effect on the thinking of economists ever since. I’m convinced that the One Lesson shows that some of his key ideas were ruinously wrong, but you should definitely evaluate the evidence for yourself rather than trusting the conclusions of some random blogger who draws diagrams with colourful arrows.
What I do give Keynes credit for is his recognition of the importance of macroeconomics. Instead of asking questions like, “how does the price of coffee affect how much of it is bought per year?”, macroeconomics considers questions about the whole economy such as “how much stuff can people buy in total in a year?”. Macroeconomics considers the dependencies between different parts of the economy. For example, how much someone spends on coffee today can affect how much they can spend on a holiday later this year, or how much they can save this year and spend in the future.
Interestingly, the One Lesson is particularly suitable for macroeconomics, because it is a linear model:
The raw net worth1 of a group of people is the exact sum of the RNWs of the members of the group; and
The effect on each person’s RNW of a set of actions is the exact sum of the effects of the individual actions.
Linear models work at a large scale just as well as at a small scale. It’s why Newton’s laws of motion explain the motions of the planets as well as the motion of small objects in a physics laboratory.
Over the coming weeks, we’ll look at macroeconomics through the lens of the One Lesson. We’ll see that it has the nice feature of being consistent with common sense.
The simplest macroeconomic model
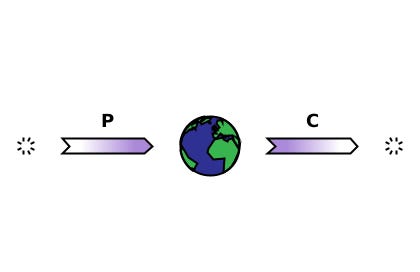
For now, let’s start by considering the whole world as a group, ignoring who owns what, and just looking at how people’s decisions and actions affect the world’s combined RNW. The diagram below represents the world economy from the beginning of time until now.
This may not look like a technical diagram, but it is: it says something very precise. It shows P, everything produced since the beginning of time until now, and C, everything consumed since the beginning of time until now. The diagram doesn’t need any other arrows because any transfers of tangible assets between people, and any actions involving debt, are just transfers within the group.
How has the world’s RNW changed between the beginning of time and now? As always, we just need to look at the arrows:
Arrows pointing to the world are increases to the world’s RNW.
Arrows pointing away from the world are decreases to the world’s RNW.
So we can see that the world’s RNW has changed by P - C. Or to put it another way, it’s increased by everything produced but not yet consumed. (It started from zero, because there was nobody to own, be owed, or owe anything).
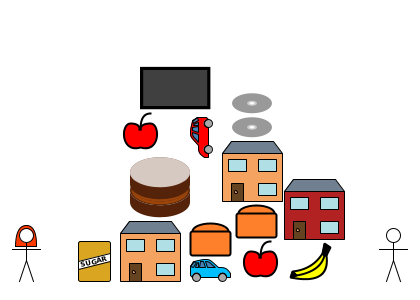
You can imagine the world’s wealth as a big pile of tangible assets. When someone produces something, they bring it into existence and add it to the pile. When someone consumes something, they take it off the pile, and use it up so it no longer exists.
Visualising the world’s wealth as a big pile of tangible assets is a good way to see that there’s no magic way to consume something unless it’s already been produced (or is being produced simultaneously). There are no cunning schemes which allow someone to consume something which hasn’t been produced yet. Anyone who claims that one exists (perhaps supposedly by using some complicated debt scheme) is at best mistaken, and may well be trying to deceive other people.
So that’s an introduction to macroeconomics. It’s probably the area where the biggest disagreements between economists take place, and it’s the one with the biggest effect on political and economic decisions, so it’s very important. I hope you’ll agree with me over the coming weeks that the One Lesson is particularly good at showing who gets what right.
Someone’s raw net worth (RNW) is what they own plus what they’re owed minus what they owe.


