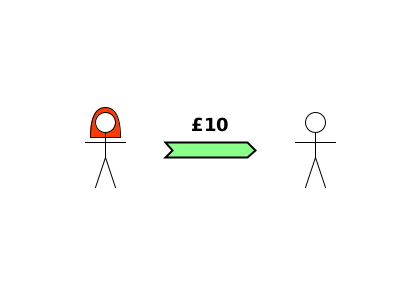
If Alice pays Bob £10 to wash her car, that’s definitely economic activity. Alice obviously loses the £10 debt asset and Bob gains it. But even though Bob’s work means that Alice ends up with a cleaner car, which is nice, and something she’s prepared to pay for, it hasn’t really changed her assets (or liabilities for that matter), so how can we represent this situation? Without something to represent Bob’s work, it looks like Alice is just giving Bob some money.
Services are a very important part of the economy, so it’s not really good enough to just treat them as though they don’t exist.
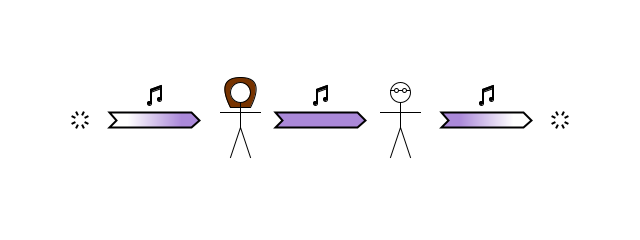
Fortunately, there’s a very easy way to think about this situation. 19th century French economist, Jean-Baptiste Say, explained in his book A Treatise on Political Economy that performing a service, such as playing music or giving medical advice is like the simultaneous production, transfer and consumption of an immaterial product.
The person performing the service is producing it, using their skill and experience, and putting in the effort (and perhaps expense) in the process. The person receiving the service is consuming it, gaining the benefits in the process. Just like a service, neither person’s raw net worth changes as a result, because the product is both added to (production arrow for Charlotte, transfer arrow for Dom) and subtracted from (transfer arrow for Charlotte, consumption arrow for Dom) each person’s RNW.
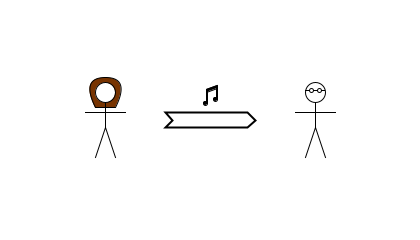
So services are already covered by the One Lesson’s 7 action types. We don’t need anything else. But showing 3 arrows for a single service can get untidy and cluttered, so we can simplify how we represent a service using a single white arrow, like this:
We just need to be aware that nobody’s raw net worth is affected by providing a service. The single white arrow shows the provider’s net worth decreasing by the product, but the production which cancels out this decrease isn’t shown. Similarly the diagram shows the recipient’s net worth increasing by the product, but the consumption which cancels out this increase isn’t shown. So when we look at an arrow diagram to see how each person’s RNW has changed, we just ignore the white arrows.
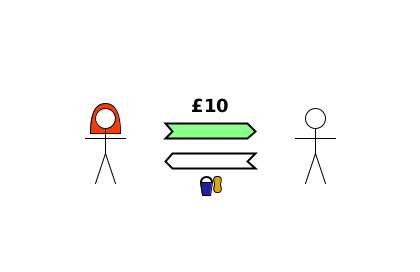
Here’s the full diagram for Alice paying Bob to wash her car (represented with a bucket and sponge):
The white arrow isn’t counted when seeing how everyone’s RNW is affected, so just like in the first diagram, we can see that Alice’s RNW has decreased by £10 and Bob’s RNW has increased by £10. But this diagram is much more useful, because it shows that Alice is receiving a service which is valuable to her in exchange.


Your prior comment regarding the concept of contingent liabilities causes me to realize our labor is a contingent asset (which also maps to the bonded slave system/concept). What an Alice or Bob does with their time and effort will determine if those assets are realized.
For your RNW purposes you ignore contingencies, yet those are another (abstracted) level or layer of economics being traded and leveraged, which compounds the risk(s) of RNW depreciation (or should I say change in value) at the non-contingent layer below.
I’m sure you plan to illustrate how/when these contingencies come into play.